
RESULTS
Biochar Significantly Increases Soil pH, SOC, and Productivity in All Land Systems
My most significant finding is that biochar application notably improved productivity by 23.4% (95% CI: 22.3–25.2%; p < 0.001) across various land systems. Biochar also significantly increased soil pH by 0.0524 (95% CI: 0.0317–0.0731; p < 0.001). This result was consistent across all the studies reviewed, highlighting biochar's role in enhancing soil alkalinity, which in turn improves nutrient availability and overall soil health (Blanco, et. . Additionally, soil organic carbon (SOC) content increased by 28.7% (95% CI: 18.7%–39.5%; p < 0.001), a key indicator of improved soil fertility. This is particularly crucial for agricultural systems, where SOC is a critical factor driving productivity.

Figure 4. The impact of biochar application on soil properties, greenhouse gas emissions, and productivity. The x-axis represents the response ratio (RR), with the dashed line indicating no significant effect (RR = 0). Points represent the average effect estimates for each parameter, and error bars denote the 95% confidence intervals. Points to the right of the dashed line indicate a positive effect relative to the control group (e.g., SOC, pH, NO₃⁻, CO₂, and productivity), while points to the left indicate a negative change (e.g., N₂O). Statistical significance is indicated by asterisks: *** indicates p < 0.001, ** indicates p < 0.01.
Biochar Application Leads to Variable Greenhouse Gas Emissions
In contrast to its positive effects on soil properties and productivity, biochar’s impact on GHG emissions was more complex. Figure 4 shows that biochar increased CO₂ emissions by approximately 19.7% (95% CI: 9.3%–31.2%; p < 0.001), a potential concern for carbon sequestration strategies. This increase in CO₂ is likely due to the accelerated microbial activity stimulated by biochar, as it enhances soil aeration and organic matter degradation.
However, the impact on N₂O emissions was significantly different. Biochar application led to a reduction in N₂O emissions by approximately 31% (95% CI: –47% to –11%; p < 0.01). This is particularly beneficial in agricultural systems where N₂O is a potent greenhouse gas. Figure 4 illustrates this negative response for N₂O, which is associated with biochar’s inhibitory effect on denitrifying microorganisms, especially in soils with low nitrogen availability.
Land-System-Specific Responses to Biochar Application
In the subgroup analysis of this study, I observed significant differences in the response to biochar application across various land systems (Figure 5). Firstly, regarding SOC, both grassland and forest exhibited notably higher SOC levels compared to agriculture (p < 0.001). This indicates that biochar effectively enhanced SOC content in grassland and forest land systems, while its effect in agriculture was relatively weaker.
For NO₃⁻, grassland exhibited a significantly higher response than forest (p < 0.05), but no significant difference was found between grassland and agriculture. This suggests that grassland systems are more responsive to biochar in increasing nitrate nitrogen, while the difference between forest and agricultural systems was insignificant.
Regarding productivity, the forest demonstrated the highest and statistically significant increase, which was significantly greater than grassland (p < 0.05). However, no significant differences were observed between agriculture and grassland, with agriculture showing no notable changes in productivity. This may be attributed to differences in bioclimatic conditions and land system soil management practices.
Regarding GHG emissions (including CO₂, CH₄, N₂O), no significant differences were observed among the land systems. This indicates that biochar did not consistently affect the reduction of these gases across different land systems, which could relate to the complexity of microbial activity and environmental conditions within each system.

Figure 5. A subgroup analysis of biochar's effects on soil parameters across different land systems and the total dataset. The forest plots show the mean RR and 95% confidence intervals (horizontal bars). Letters (a, b, ab) above the points denote significant differences between subgroups, based on post hoc comparisons (p < 0.05). The statistic QM and its corresponding p-value in each panel refer to the subgroup meta-regression test of moderation.
Environmental Drivers Modulating Biochar Efficacy
The relationship between biochar application rate and the response ratios for NH₄⁺ and productivity was significant in agricultural systems. Figure 6A shows that an increased biochar application rate led to a reduction in NH₄⁺ levels in agricultural soils (R² = 0.38, p < 0.05), suggesting a dose-dependent inhibitory effect on nitrogen mineralization. Conversely, Figure 6B shows no significant correlation between biochar application rate and productivity in grasslands and forests, indicating that these land systems may be less responsive to varying biochar application rates. The results imply that biochar application rates should be carefully adjusted in agriculture, while the benefits in other land systems, such as grasslands, may be limited by factors like nitrogen availability or other land system-specific conditions.

Figure 6. Correlation Between Biochar Application Rate and NH₄⁺ (A) /Productivity (B)
When examining the effect of biochar application duration, Figure 7 illustrates that the duration of biochar application had a more pronounced effect on productivity and NH₄⁺ dynamics in agricultural systems, with R² values of 0.92 (p < 0.01) for productivity. This suggests that the benefits of biochar in agricultural systems may be more short-term and evident within a few hundred days. However, for grasslands, no significant trend was observed for either productivity or NH₄⁺ levels with increasing application duration (R² = 0.18, p = 0.77), suggesting that the impact of biochar may plateau over time in these land systems.

Figure 7. Correlation Between Biochar Application Duration and Productivity (A) /NH₄⁺ (B) /CO₂ (C)
The analysis of MAT revealed notable differences in biochar efficacy across land systems. Figure 8A shows that in agricultural systems, biochar application resulted in a significant increase in soil pH (R² = 0.14, p < 0.05), with warmer temperatures enhancing biochar's effects. This suggests that temperature might amplify the benefits of biochar in regulating soil acidity, which can improve nutrient availability. In contrast, Figure 8B shows a weaker relationship for nitrate (NO₃⁻) levels with MAT in forests and grasslands (R² = 0.22, p = 0.53). This finding indicates that temperature is not a strong modulator of biochar's impact on NO₃⁻ dynamics in these land systems, possibly due to a combination of high baseline nitrogen levels in forests and moisture limitations in grasslands.

Figure 8. Correlation Between MAT and pH (A)/ NO₃⁻ (B)
In the case of MAP, Figure 9A indicates that biochar application significantly affected pH levels in agricultural systems (R² = 0.2, p < 0.05), with higher precipitation correlating with increased biochar-induced changes in pH. This suggests that the benefits of biochar might be more evident in areas with moderate rainfall, which supports nutrient cycling processes influenced by biochar. On the other hand, Figure 9B shows that MAP had no significant influence on the effects of biochar on NO₃⁻ in grasslands (R² = 0.22, p = 0.53). This lack of correlation might be due to the varying influence of moisture on biochar’s role in nitrogen cycling, which could be overridden by other climatic or soil factors in these systems.

Figure 9. Correlation Between MAP and pH (A)/ NO₃⁻ (B)
Hierarchical Drivers of CO₂ Flux and Productivity Responses to Biochar Application
In the context of biochar application, understanding the effects on CO₂ emissions and productivity is crucial for evaluating both its environmental and agricultural benefits. CO₂ emissions are a key concern in climate change mitigation strategies, as they represent a significant greenhouse gas contributing to global warming. Conversely, productivity is a direct measure of biochar’s effectiveness in enhancing soil fertility and agricultural output, which is essential for ensuring food security and sustainable land management. Given that biochar can influence microbial activity and soil processes in complex ways, it is vital to assess how these two factors are impacted across different land systems. Therefore, focusing on CO₂ emissions and productivity enables us to better understand the broader implications of biochar use, balancing its potential for carbon sequestration with its role in improving land system functioning. This emphasis is particularly relevant in light of the varied responses observed across agricultural, forest, and grassland systems, as it provides insights into how biochar can be optimized for both environmental sustainability and agricultural productivity.
The random forest analysis provided important insights into the primary factors driving biochar’s impact on both CO₂ emissions and productivity, with distinct patterns observed across agricultural, forest, and grassland systems. These patterns emphasize the necessity of land system-specific management strategies, as the influence of various environmental drivers differed significantly between land systems.
Figure 10 shows the relative importance of different predictors for CO₂ emissions across land systems. In agricultural systems (Figure 10A), MAT and MAP were the primary drivers of CO₂ emissions. MAT had the strongest influence (R² = 0.49, p < 0.05), reflecting the temperature-sensitive microbial decomposition of biochar. In forest systems (Figure 10B), duration of biochar application emerged as the most significant factor (R² = 0.4, p = 0.05), suggesting that longer application periods allow biochar to integrate into the soil matrix and influence CO₂ flux over time. In grassland systems (Figure 10C), Rate was the most significant predictor of CO₂ emissions (R² = 0.79, p < 0.01). This finding suggests that in nutrient-poor soils, higher biochar rates could lead to increased microbial activity and higher CO₂ emissions, indicating that optimal application rates are crucial in grasslands to mitigate emission peaks.
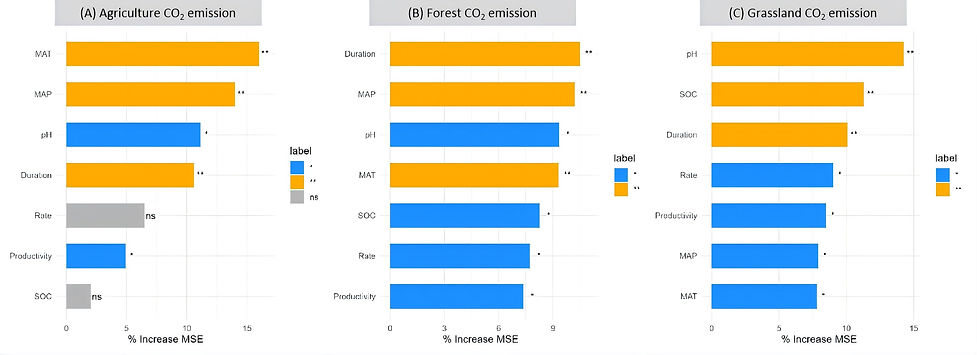
Figure 10. Random forest importance analysis (rfPermute) for CO₂ emissions across three land systems: (A) Agriculture, (B) Forest, and (C) Grassland. The horizontal axis shows the percentage increase in mean squared error (%IncMSE) upon permutation of each predictor variable, indicating the relative importance of that variable in predicting CO₂ emissions. Bars are colored based on statistical significance (***: p < 0.001; **: p < 0.01; *: p < 0.05; ns: not significant).
Similarly, the random forest analysis for productivity responses to biochar (Figure 11) revealed distinct hierarchical drivers across systems. In agricultural systems (Figure 11A), soil pH emerged as the most influential factor, indicating that biochar’s effect on productivity is closely tied to pH improvement, which enhances nutrient bioavailability. In forest systems (Figure 11B), duration of biochar application and SOC were the most important factors, highlighting that biochar’s long-term effects on soil structure and nutrient cycling are crucial for productivity enhancement. In grasslands (Figure 11C), soil pH was again the most significant driver, underlining the importance of pH adjustments for improving productivity in nutrient-deficient soils.

Figure 11. Random forest importance analysis (rfPermute) for productivity across three land systems: (A) Agriculture, (B) Forest, and (C) Grassland. The horizontal axis shows the percentage increase in mean squared error (%IncMSE) upon permutation of each predictor variable, indicating the relative importance of that variable in predicting CO₂ emissions. Bars are colored based on statistical significance (***: p < 0.001; **: p < 0.01; *: p < 0.05; ns: not significant).
CONCLUSION
This study underscores the significant and variable effects of biochar application across different land systems, highlighting its potential to enhance soil properties, productivity, and greenhouse gas emissions dynamics. The findings demonstrate that biochar application consistently improves soil pH and SOC content, with a 23.4% increase in productivity across diverse land systems. These benefits are particularly pronounced in agricultural systems, where biochar enhances soil fertility and drives productivity gains. However, the complexity of biochar's impact on greenhouse gas emissions, particularly CO₂, highlights the need for nuanced management practices to mitigate potential adverse effects on carbon sequestration strategies. While biochar increased CO₂ emissions in agricultural systems, it effectively reduced N₂O emissions, suggesting a potential benefit in reducing global warming potential in agricultural soils.
The study also reveals important differences in the efficacy of biochar across land systems. In forests, biochar had a limited effect on SOC content due to already high baseline carbon stocks, while grasslands exhibited a strong response in reducing N₂O emissions. These findings emphasize the importance of tailoring biochar application strategies based on specific biogeochemical conditions and land management practices. Additionally, biochar’s effectiveness in enhancing soil pH and promoting productivity is most evident in tropical agricultural systems, where its impact on acidic soils is maximized.
The duration and application rate of biochar significantly influenced its impact on both productivity and soil nitrogen dynamics, with agricultural systems showing a stronger response to biochar over short-term periods. Meanwhile, temperature and precipitation played key roles in modulating biochar's effectiveness, with warmer conditions enhancing its ability to regulate soil pH and nutrient cycling, particularly in agricultural systems.
In conclusion, biochar offers a promising tool for improving soil health and mitigating greenhouse gas emissions, but its efficacy is highly context-dependent. Future research should focus on refining application rates and exploring long-term effects across different land systems to maximize the benefits of biochar while minimizing potential trade-offs, particularly in terms of CO₂ emissions. Tailored strategies that account for specific system conditions, such as soil type, climate, and land use, will be essential for realizing biochar's full potential in both agricultural and natural land systems.
Limitations and Future Directions
-
This study provides valuable insights into the land system-specific impacts of biochar on soil properties, productivity, and greenhouse gas emissions. The identification of biochar application rate, duration, and climatic factors such as temperature and precipitation as key drivers suggests that optimizing biochar application strategies requires tailoring them to specific systems. However, some limitations must be acknowledged in interpreting these results.
-
One key limitation is the relatively small dataset used in this analysis, with only 22 studies included. This is far fewer than the typical dataset used in meta-analyses, potentially introducing selection bias and limiting the generalizability of the findings. Additionally, the reliance on a finite subset of available studies means that the current analysis may not capture the full spectrum of land system-specific responses to biochar. To mitigate this, data imputation methods such as multiple imputation and bootstrap resampling were employed, but these methods inherently assume random missing data, which might not fully reflect real-world complexities of biochar effects. As a result, the conclusions may be somewhat optimistic, especially when extrapolating to different regions or conditions.
-
Furthermore, the use of interpolated data in the random forest analysis to fill in gaps in missing information may have influenced the results, providing a more optimistic view of biochar’s potential impacts. While this approach improved model robustness, future studies should prioritize using larger and more diverse datasets, particularly from underrepresented systems, to validate these findings.
-
Despite these limitations, the random forest analysis demonstrated strong explanatory power for CO₂ emissions and productivity, identifying key variables such as application rate, duration, temperature, and pH as critical factors driving biochar's effects. However, more long-term (>5 years) and large-scale field trials are needed to confirm these findings, particularly in systems such as boreal forests and arid grasslands, where biochar’s effects remain less understood.
-
In conclusion, while our study provides an important framework for understanding the role of biochar in soil management and climate mitigation, future research should focus on expanding the global biochar monitoring network. Large-scale, long-term studies that consider the full complexity of system interactions and the long-term sustainability of biochar use are essential to refine predictive models and inform scalable climate solutions. These efforts will help optimize biochar application strategies and ensure that it can be used effectively to enhance soil health, boost productivity, and mitigate greenhouse gas emissions across different systems.